

What Substack's Dashboard Doesn't Show You
A conversation with the builder who cracked open Substack's hidden analytics layer — and what her data revealed about newsletter performance.


Karen Spinner connects with us to share her experiences in building the Substack Newsletter Audit Tool.
If you run a Substack newsletter, you know the dashboard. Subscriber count, open rates, a handful of charts. You check it after every post, maybe compare a few numbers week over week, and move on. It tells you something — but not enough.
I wanted more. Specifically, I wanted to know which posts actually drive engagement, how content performs over time, and whether there are patterns hiding in the data that Substack’s default view doesn’t surface. Last year, I tried building my own analytics dashboard using Cursor. I used RSS feeds as the backbone, layered in BeautifulSoup to scrape engagement metrics, got the data into Excel, and even built a basic Flask web dashboard.
It worked — partially. I could extract post titles, word counts, likes, comments, and rank top-performing posts side by side. But the real metrics I wanted — reliable subscriber counts, conversion rates, churn — kept breaking. The subscriber count came back erroneous on multiple runs. Some figures looked fabricated when the code couldn’t extract the real data. Without a documented API, I was guessing at Substack’s internal data structure and hoping my scraper wouldn’t break with the next page update.
I put the project on hold. The tool was useful for basic post comparisons but not reliable enough for the numbers that actually matter.
Then I came across Karen’s work.
Karen Spinner builds with AI and documents every win, bug, and failure on her newsletter, Wondering About AI. Over the past year, she’s shipped multiple Chrome extensions for Substack, each one going deeper into the platform’s internals. One of her latest — the Substack Newsletter Audit — taps directly into Substack’s internal API endpoints to surface metrics the default dashboard doesn’t show.
The extension is built on an audit methodology developed by Sharyph, creator of The Digital Creator, who published a detailed playbook identifying seven metrics that actually predict newsletter revenue. Karen turned that framework into a working tool.
Link to Substack Newsletter Audit extension: https://karenspinner.gumroad.com/l/lrfuj
The extension is available as a standalone purchase on Gumroad, but it’s also included free for paid subscribers to Wondering About AI — alongside her other Substack tools like Reader (for managing subscriptions at scale), hands-on workshops where builders demo projects and debug together, and access to everything Karen ships as she keeps building. If you’re already following her work, the paid tier is where the toolkit lives.
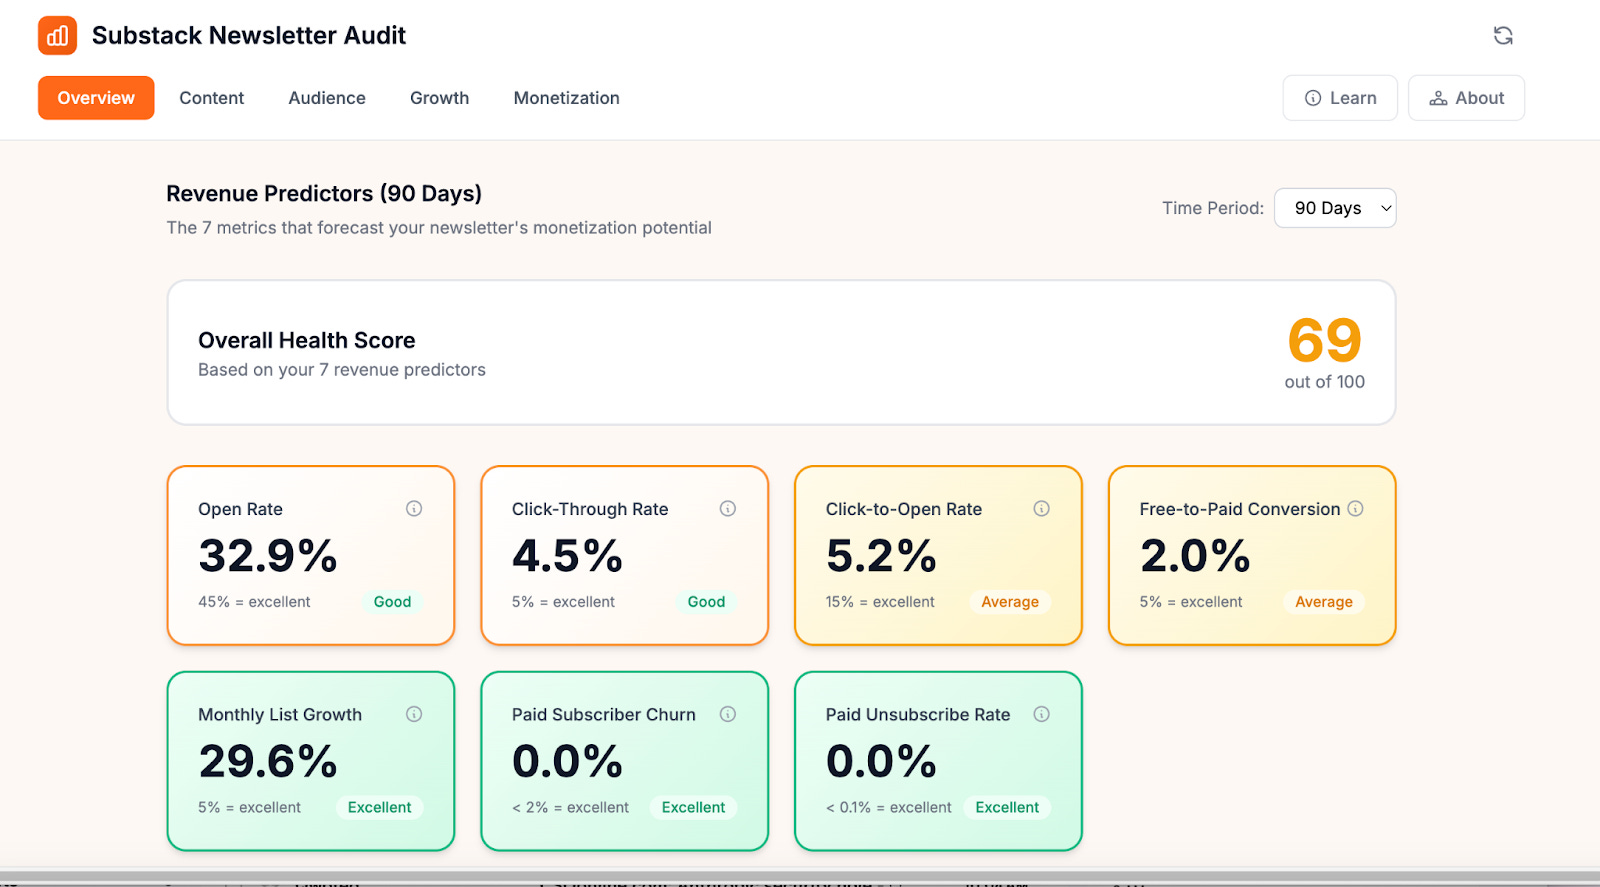
I installed it on Cash & Cache. The first thing I noticed: weighted open rates, cleaned-up click-through rates (stripped of inflated Like button clicks), per-post paid conversion tracking, recommendation network data, and a health score benchmarked against industry standards. All running locally in the browser, no data leaving my machine.
I wanted to understand how she built it, what broke along the way, and what the data actually revealed. Naturally, I invited Karen for a conversation to learn more!
Want to watch the Substack Newsletter Audit Tool in action straightaway? Feel free to scroll down and watch the demo in the prerecorded video call attached. 🎥
🗣️The Conversation
You’ve now built multiple Chrome extensions for Substack — Reader, StackDigest, and now the Newsletter Audit. Each one goes deeper into Substack’s internals. Is there a bigger picture here for you, or does each project start as its own standalone itch to scratch?
Each one started to solve a standalone problem. StackDigest began because I had over 200 Substack subscriptions and my inbox was drowning — I just needed a way to surface what I wanted to read without scrolling forever through my Substack feed.
I built Reader after I heard from users who missed StackDigest and didn’t want to deal with installing the open source code I added to GitHub. (Currently, the open source version, which Karen Smiley is a major contributor to, is powering weekly digests for She Writes AI.)
And the Newsletter Audit happened because I was conducting some research before my paid launch and found a really cool article spelling out seven metrics that predict newsletter profitability. I reached out to Sharyph, the author of the article, and we worked together to turn it into a tool.
But looking back, there’s clearly a thread connecting all of them: Substack gives creators a very curated view of their own data, and I keep bumping into questions the default dashboard can’t answer. Each project pulled me deeper into their undocumented API, and each time I learned something new about what’s actually available under the hood. StackDigest taught me the API existed and what it could do at scale — and that using it at scale in the context of a commercial app was probably not compliant with Substack’s TOS (I am not a lawyer, and this is not legal advice!).
Reader was a deliberate step back to something local-only and lower-risk. The Audit takes a similar approach, except it’s aimed at creators who have monetized their newsletters and are looking to grow.
So it’s not a master plan, but it’s definitely not random either. Creators need better tools for understanding their own data, and Substack isn’t building them fast enough — yet.”
Most Substack creators only ever see the default dashboard — subscriber count, open rates, a few charts. Having now dug deep under the hood, what surprised you most about what Substack actually tracks behind the scenes versus what they choose to surface to creators?
I think they do surface a lot of useful data for creators, but it’s not organized in a way that’s really helpful. For example, their post-level API returns clicks broken down by individual link. But you have to click on each individual post’s analytic panel to see this, and you can’t easily compare which posts are getting the most clicks or which links readers are clicking on in aggregate, across all your posts.
Similarly, Substack captures lots of great information around recommendations — how many subscribers you’ve gained from each publication that recommends you, and how many you’ve sent their way. But to see this information inside Substack, you actually have to exit the analytics panel, go to your newsletter website, and click on manage recommendations.
The other surprise was what’s genuinely hard to get, even from the API. There’s no single endpoint that gives you a clean churn rate or a weighted average open rate. The dashboard shows a simple open rate, but that treats a post sent to 100 people the same as one sent to 10,000. To get an accurate picture, I had to fetch detailed stats for every individual post and calculate the weighted average myself.
The short answer: Substack collects remarkably comprehensive data, but the dashboard could make it easier to view and understand.
You mentioned there’s no single endpoint for churn rate or weighted open rates — you had to build those calculations yourself. How do you validate that your calculated metrics match reality? Is Substack’s own dashboard your source of truth, and what do you do when even that seems off?
For the metrics Substack does calculate — like the 30-day open rate — yes, their dashboard is the source of truth, and we actually use their number directly. The API returns it pre-calculated, so there’s nothing to validate there. Where it gets interesting is the derived metrics.
For something like weighted open rate, the inputs are all Substack’s own numbers — each post’s open rate and delivery count come straight from their API. The math is just a weighted average: multiply each post’s open rate by how many people received it, sum those up, divide by total deliveries. There’s no mystery in the formula, so as long as the inputs are right, the output is right.
The same is true for click-through rate, conversion rate, and unsubscribe rate — they’re simple divisions of numbers Substack provides. We’re not estimating anything; we’re just doing the arithmetic Substack chose not to surface.
The one place I’d flag some imprecision is churn. Substack gives you paid subscriber counts at the start and end of a 90-day window, but not a monthly churn rate. So we divide the 90-day change by three, which assumes churn was roughly even across those months. If someone lost most of their paid subscribers in month one and then stabilized, the monthly number would be misleading. That’s a known limitation — without monthly snapshots from Substack, it’s the best approximation available.
As for when things seem off — that’s usually a signal to check the inputs, not the formula. Substack’s click data includes “Like button” clicks, which can inflate CTR. We strip those out because clicking a heart isn’t the same as clicking through to a link. So our CTR may look lower than what someone sees on Substack’s dashboard, but it’s a more useful number.
You mentioned cataloguing over 25 internal API endpoints by intercepting network requests as you navigated the dashboard. For someone who’s never done this before, can you walk us through what that discovery process actually looked like — and how you went from “I can see these requests in DevTools” to “I can build a tool on top of them”?
It’s very easy to explore API endpoints using a Chromium browser (e.g., Chrome itself or any of the other browsers built in it). You open Chrome DevTools, right-click, Inspect, go to the Network tab, and filter by Fetch or XHR. Then you just navigate around Substack’s dashboard and watch API requests populate in real time. Every time you load a page, click a tab, or scroll, your browser is making requests to Substack’s servers and getting structured JSON back. It’s not exactly hidden; it’s just not advertised.
This short video shows what this process looks like:
But, if you’re just clicking around in browser tools, you’ll miss a lot. When I was looking for endpoint for the Newsletter Audit, I refreshed a single screen and saw 169 requests, which is a lot to manually check, and many of the interesting endpoints only fire under specific conditions, like lazy-loading as you scroll, background polling, or UI components that only render when you have paid subscribers enabled or when you’re viewing a specific date range. So, I had Claude write a script that intercepted and logged every API call as I navigated. That’s how I caught endpoints I never would have found manually.
The jump from ‘I can see these’ to ‘I can build with these’ comes from examining the response structure. Each endpoint returns JSON with predictable fields. Once you understand the data that each endpoint is returning, you can make the same authenticated requests from a Chrome extension instead of from the browser’s own dashboard code.
However, it’s important to keep in mind that these endpoints are undocumented and unsupported. Substack doesn’t publish them, there’s no developer program, and they could change or disappear without notice. Building on undocumented APIs means accepting that your tool could break tomorrow. I’ve tried to be respectful by adding delays between requests, caching aggressively, and keeping everything local, but the risk is real, and anyone thinking about building on these endpoints should understand that going in.
The TOS situation adds another layer of complexity. Substack’s terms prohibit scraping and crawling in broad language, and there’s no official channel to ask whether a particular use is acceptable. For a tool that reads only your own analytics data locally, I believe the risk is relatively low, but it’s not zero, and I’m not a lawyer. That ambiguity is something every builder in this space has to navigate for themselves.
The risks and uncertainty described above were why I ultimately shut down StackDigest instead of launching it as a paid app.
This is where my approach and Karen’s diverged. I used RSS as my backbone — structured, stable, full post history. But RSS doesn’t carry engagement metrics, so I was scraping HTML for likes and comments, and that’s where reliability fell apart. Karen’s approach of intercepting the actual API calls Substack makes to itself is a fundamentally different entry point. She’s reading the same data Substack’s own dashboard reads. That’s why her data is more complete — and it’s why my subscriber count kept coming back wrong while hers doesn’t.
You built this during your own paid launch, which means you were simultaneously the developer and the first real user. How did that change the tool? Were there things you only caught or prioritized because you were relying on the data in real time for your own decisions?
Being your own first user is a cliché in product development for a reason. It’s a great way to test the tool and find out just how useful (or buggy) it actually is.
The biggest thing I caught was a crash bug that only surfaced because most of my posts are published to the web but not emailed. The app was dividing by the number of emails sent, and when that number was zero, it broke. With synthetic test data, you’d never think to include that edge case. But for someone like me who publishes some posts as web-only, it was an immediate crash on first use.
I also completely redesigned the UI partway through because of real usage. The first version treated all metrics with equal visual weight; everything got the same size card, the same prominence. But after a couple of days of actually using it to make decisions, I realized the seven revenue predictors needed to dominate the screen because they’re the whole point of the audit. I moved secondary metrics to their own tabs.
And then there were the subtle data issues. For example, Substack’s click count included ‘Like button’ clicks, which inflated the click-through rate. I only noticed because the numbers felt wrong based on what I knew about my own newsletter’s engagement.
The crash bug from web-only posts is a great example — that’s the kind of edge case no amount of planning catches. Now that other creators are using the tool, have they surfaced bugs or edge cases that surprised you just as much?
The core issue is that Substack’s authentication cookies are tied to substack.com, so when a publication uses a custom domain, the browser won’t include those cookies in API requests; instead, the extension has to handle that behind the scenes. On top of that, some custom domains are configured as www dot domain dot com rather than the bare domain, and the extension initially didn’t try both variants. The latest version now on Gumroad addresses both issues. I even set up a custom domain using an alt newsletter account to test it.
I’m still working with one user to test if the new version works for configs in which www dot domain dot com is set up as the main domain and a non-Substack web server is redirecting the base domain.
Cash & Cache covers AI implementation for the people actually building in this space — tech leaders, VCs, and operators who want signal over noise. If your product belongs in front of that audience, check out our sponsorship options, or connect with me directly to discuss.
After building the tool and running your own audit, you scored your newsletter at 83/100 — green but barely. Without getting too personal, what was the most surprising insight the extension surfaced about your own newsletter? The kind of thing Substack’s default dashboard would never have shown you?
The 83 was honestly better than I expected — and it’s now down to 69 because I’m adding free users much faster than paid ones. I think this is to be expected, because most people opt for paid subscriptions during a launch or special promotion, and my recent focus has been delivering a great experience for existing subscribers.
Probably the most surprising insight was about the relationship between engagement and conversion. The Content tab makes it easy to separate engagement metrics from actual paid signups, and see which posts are driving each. The article that brought in the most paid subscribers for me has a pretty low open rate and didn’t attract that many free subscribers.
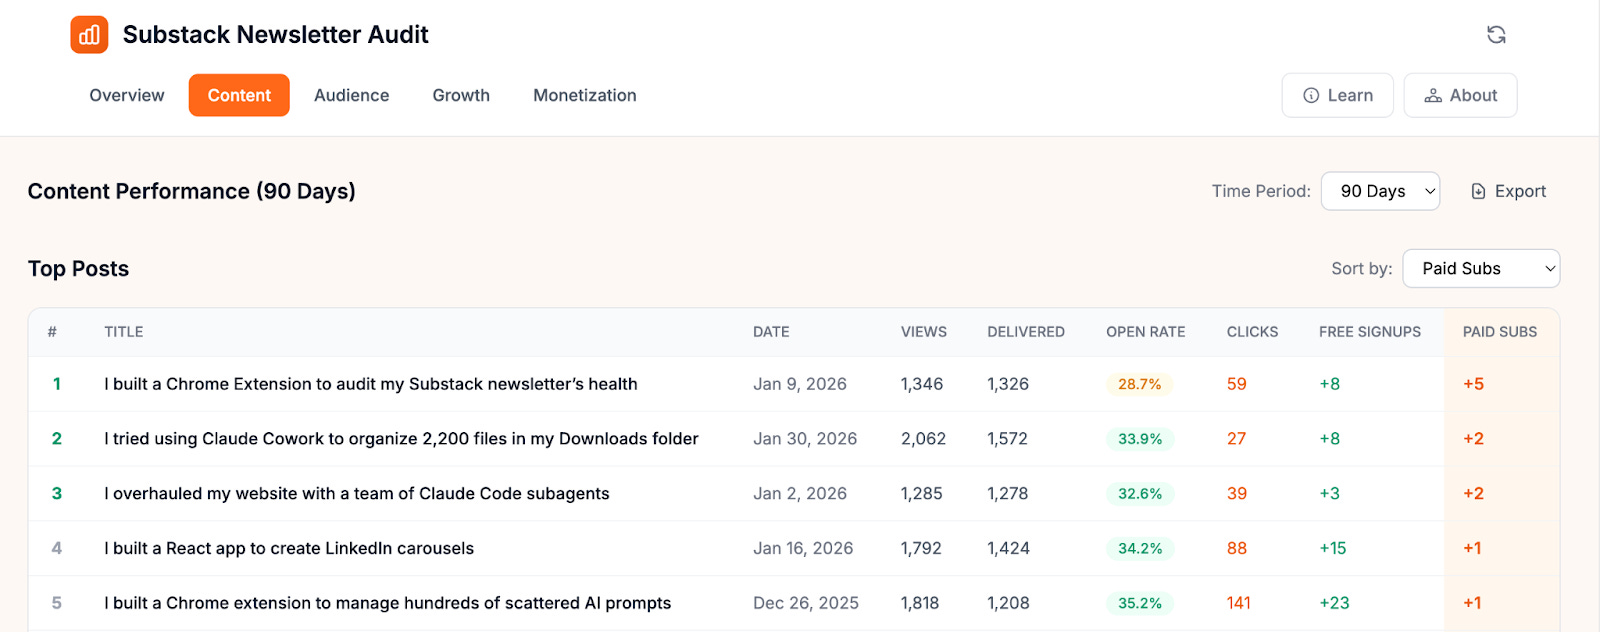
Sharyph had flagged this exact pattern in his playbook — his most popular posts got zero conversions, while a specific topic was quietly driving paid signups despite less visible engagement.
That insight about low-engagement posts driving paid conversions is genuinely counterintuitive. It almost challenges the whole Substack playbook of optimizing for likes and comments. Has this changed how you think about what “good performance” means for a post — and has it shifted your own content strategy?
I think it’s important to have both kinds of posts–high-engagement posts to grow your audience plus more targeted posts addressing potential paid subscriber pain points. Ideally, you should publish both types, perhaps one each week. But I don’t have the time and energy for that, so I’m sticking to my weekly cadence and looking at growing my audience through SEO.
🎬 Watch: Substack Newsletter Audit — Live Demo and Discussion
In this recording, Karen walks through a live demo of the Substack Newsletter Audit extension — what each tab shows, how to read the metrics, and what to look for first if you only have ten minutes. We also discuss how creators can turn raw data into actual content decisions. While the written conversations earlier were about the technical detailing of the tools, the video recording is a practical guide into using it and what creators can takeaway from their newsletter audit results.
📝 What I Took Away
Three things stood out.
The engagement-conversion disconnect is real. Karen’s data confirmed what Sharyph’s playbook predicted: the posts that get the most likes and comments aren’t necessarily the ones driving paid subscriptions. If you’re only optimizing for visible engagement, you might be doubling down on content that grows your audience but never converts it. Karen’s Content tab makes this split visible for the first time — and it made me want to look at Cash & Cache’s own numbers through this lens.
Building on undocumented APIs is a conscious tradeoff. The extension works because Substack’s internal endpoints are predictable and well-structured. But they’re not documented, not officially supported, and could change without notice. Karen mitigates this by keeping everything local, caching aggressively, and adding request delays. She even shut down a previous project when the TOS risk felt too high. The tool is useful precisely because it accesses data Substack doesn’t officially surface.
Substack’s data is better than its dashboard. Per-link click data, recommendation network stats, post-level conversion attribution — most of it exists in their API. They just don’t make it easy to see. Karen’s tool doesn’t invent new data. It does the arithmetic Substack chose not to surface. That framing matters: this isn’t a hack, it’s a lens.
Try It Yourself 🫵
You can purchase the Substack Newsletter Audit extension standalone, or get it free as part of a paid subscription to Karen’s newsletter, Wondering About AI.
Paid subscribers also get access to her other tools, live workshops where builders demo and debug projects together, and first access to everything she ships. For creators who want to build alongside someone doing it in public, it’s a good deal.

Link to the Substack Newsletter Audit extension on Gumroad for standalone purchase: https://karenspinner.gumroad.com/l/lrfuj
And if you want to understand the audit methodology behind the tool, Sharyph’s Complete Substack Newsletter Audit Playbook is the foundation:

What does your Substack data actually look like when you dig past the default dashboard? If you’ve run the audit on your newsletter, which metric caught you off guard — and did it change what you publish next?
The approach behind this piece — testing tools, documenting what works, and turning real builder conversations into practical takeaways — is how we cover AI implementation at Cash & Cache.
We’re building toward a paid subscription that goes deeper: full implementation guides, the research behind each workflow, and the tools we develop along the way. If this conversation gave you something concrete to think about for your own newsletter, the paid tier is where we’ll break down the systems behind it.

 | A guest post by
|
Makes you wonder why Substack doesn’t provide better support for this. More paid subscribers means more revenue for Substack…
thank you, Raghav, Karen and Ashwin! the video explaining how to install the plug-in on chrome was super useful!